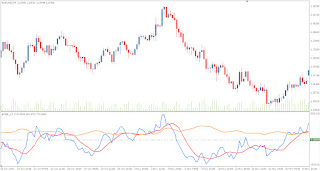
Very good treatment indicator that shows Bobby v1 breakouts
Bollinger Bands,
Moving average - MA and the width of the bands. Orange line shows width of the bands, blue line is the difference of the two lines and red line is Moving average - MA. Crossing zeroline to below - Sell, crossing to above - Buy. If you need to reliably project prices under different market conditions, estimate risk on new positions, Forex indicator BOBB v2 is the good indicator.
//+------------------------------------------------------------------+
//|                                                      BOBB_v2.mq4 |
//|                                         Based On Bollinger Bands |
//|                                                   mg@downspin.de |
//+------------------------------------------------------------------+
#property copyright "Copyright @ 2011, downspin"
#property link      "mg@downspin.de"

#property indicator_separate_window
#property indicator_buffers 3
#property indicator_color1 DodgerBlue
#property indicator_color2 Red
#property indicator_color3 Orange
#property indicator_level2 0

extern int    BandsPeriod=20;
extern double BandsDeviations=1.0;
extern int MA_Period=9;

double val[],
       MA[],
       dev[];

int init(){
  SetIndexStyle(0,DRAW_LINE); SetIndexBuffer(0,val);
  SetIndexStyle(1,DRAW_LINE); SetIndexBuffer(1,MA);
  SetIndexStyle(2,DRAW_LINE); SetIndexBuffer(2,dev);
  return(0);
}

int deinit(){return(0);}

int start(){
  double sum,ma;
  for(int i=Bars-IndicatorCounted();i>=0;i--){
    ma=iMA(NULL,0,BandsPeriod,0,MODE_SMA,PRICE_CLOSE,i);
    sum=0.0;
    for(int k=i+BandsPeriod-1;k>=i;k--) sum+=MathPow(Close[k]-ma,2);
    dev[i]=BandsDeviations*MathSqrt(sum/BandsPeriod)/Point;
    val[i]=(Close[i]-ma)/Point;
    MA[i]=val[i]/MA_Period;
    for(int o=1;o<MA_Period;o++) MA[i]+=val[i+o]/MA_Period;
  }
  return(0);
}

