 |
| SinTrend |
 |
| SinTrend |
 |
| SinTrend |
 |
| SinTrend |
 |
| SinTrend |
 |
| SinTrend |
 |
| SinTrend |
 |
| SinTrend |
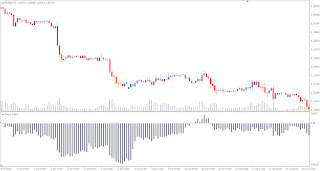
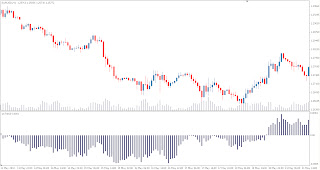
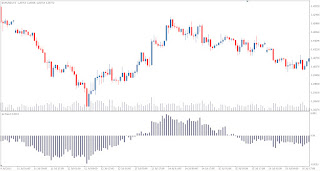
SinTrend was published in 2005 by Nikolay Kositsin, designed to determine market trends and input / output signals. Indicator is applicable to intraday time frames as well as longer-term horizons. The SinTrend direction is determined by the histogram location relative to the zero level. Entry signals appear during the zero line breakout. If the histogram is above the level of zero-buy, in the opposite case, it is time to Sell. Very interesting indicator to determine the power of the market and the trend in the market.
SinTrend MQ4 Code Base (Copy Code)
//+------------------------------------------------------------------+
//|                                                     SinTrend.mq4 |
//|                      Copyright © 2005, MetaQuotes Software Corp. |
//|                                        http://www.metaquotes.net |
//+------------------------------------------------------------------+
#property copyright "Copyright © 2005, DVYU."
#property link      "http://www.DVYU.ox"
#property indicator_buffers 1
#property indicator_color1 Yellow
#property indicator_separate_window
//#property indicator_minimum -1
//#property indicator_maximum 1
//ďŕđŕěĺňđű
int g_period;
//.extern int dBar=3;
//Îáú˙âëĺíčĺ ăëîáŕëüíűő ďĺđĺěĺííűő
double z_buffer[];
//double SpeedTrend1;
double dBar;
int x;
//+------------------------------------------------------------------+
//| Custom indicator initialization function                         |
//+------------------------------------------------------------------+
int init()
  {

  SetIndexStyle(0, DRAW_HISTOGRAM, EMPTY, 2, Yellow);
  SetIndexBuffer(0,z_buffer);
  IndicatorDigits(4);

  int x=Period();
  //string P;
  //Äë˙ ďîäáîđŕ ńěĺůĺíč˙ (shift) číäčęŕňîđŕ čçěĺíčňĺ çíŕ÷ĺíčĺ g_period äë˙ íóćíîăî ďĺđčîäŕ ăđŕôčęŕ
  switch (x)
  {
  case 1:g_period=110;
  Comment("Ěčíóňíűé ăđŕôčę","   ","Ńěĺůĺíčĺ",g_period);
  break;
  case 5:g_period=90;
  Comment("Ď˙ňčěčíóňíűé ăđŕôčę","   ","Ńěĺůĺíčĺ",g_period);
   break;
  case 15:g_period=60;
  Comment("Ď˙ňíŕäöŕňčěčíóňíűé ăđŕôčę","   ","Ńěĺůĺíčĺ",g_period);
   break;
  case 30:g_period=42;
  Comment("Ďîëó÷ŕńîâîé ăđŕôčę","   ","Ńěĺůĺíčĺ",g_period);
   break;
  case 60:g_period=36;
  Comment("×ŕńîâîé ăđŕôčę","   ","Ńěĺůĺíčĺ",g_period);
   break;
  case 240:g_period=24;
  Comment("×ĺňűđĺő÷ŕńîâîé ăđŕôčę","   ","Ńěĺůĺíčĺ",g_period);
   break;
  case 1440:g_period=18;
  Comment("Äíĺâíîé ăđŕôčę","   ","Ńěĺůĺíčĺ",g_period);
   break;
  case 10080:g_period=12;
  Comment("Íĺäĺëüíűé  ăđŕôčę","   ","Ńěĺůĺíčĺ",g_period);
   break;
  case 43200:g_period=3;
  Comment("Ěĺń˙÷íűé ăđŕôčę","   ","Ńěĺůĺíčĺ",g_period);
   break;
  }
   return(0);
  }
//+------------------------------------------------------------------+
//| Custor indicator deinitialization function                       |
//+------------------------------------------------------------------+
int deinit()
  {
//----

//----
  return(0);
  }
//+------------------------------------------------------------------+
//| Custom indicator iteration function                              |
//+------------------------------------------------------------------+
int start()
  {
  int limit = 0;
  int z;
int counted_bars=IndicatorCounted();
      if(counted_bars<0) return(-1);
          if(counted_bars>0) counted_bars--;
              limit=Bars-counted_bars;

   for  (int i=0; i<limit; i++)
{

 z_buffer[i]=MathSin((Close[i]-Close[i+g_period])/g_period);


 }


//----

//----
   return(0);
  }
//+------------------------------------------------------------------+
SinTrend MQ5 Code Base (Copy Code)
//+------------------------------------------------------------------+
//|                                                     SinTrend.mq5 |
//|                                           Copyright © 2005, DVYU |
//|                                              http://www.DVYU.ox/ |
//+------------------------------------------------------------------+
#property copyright "Copyright © 2005, DVYU"
#property link      "http://www.DVYU.ox/"
//---- indicator version
#property version   "1.00"
//---- drawing the indicator in a separate window
#property indicator_separate_window
//---- number of indicator buffers 2
#property indicator_buffers 2
//---- only one plot is used
#property indicator_plots   1
//+----------------------------------------------+
//|  Indicator drawing parameters                |
//+----------------------------------------------+
//---- drawing the indicator as a three-color histogram
#property indicator_type1 DRAW_COLOR_HISTOGRAM
//---- the following colors are used in the histogram
#property indicator_color1 Gray,DeepPink,DodgerBlue
//---- indicator line is a solid one
#property indicator_style1 STYLE_SOLID
//---- indicator line width is equal to 2
#property indicator_width1 2
//---- displaying the indicator label
#property indicator_label1  "SinTrend"
//+----------------------------------------------+
//| Horizontal levels display parameters         |
//+----------------------------------------------+
#property indicator_level2  0.0
#property indicator_levelcolor Gray
#property indicator_levelstyle STYLE_DASHDOTDOT
//+----------------------------------------------+
//| Enumeration for the time series selection    |
//+----------------------------------------------+
enum Applied_price_      // Type of constant
  {
   PRICE_CLOSE_ = 1,     // Close
   PRICE_OPEN_,          // Open
   PRICE_HIGH_,          // High
   PRICE_LOW_,           // Low
   PRICE_MEDIAN_,        // Median Price (HL/2)
   PRICE_TYPICAL_,       // Typical Price (HLC/3)
   PRICE_WEIGHTED_,      // Weighted Close (HLCC/4)
   PRICE_SIMPLE,         // Simple Price (OC/2)
   PRICE_QUARTER_,       // Quarted Price (HLOC/4)
   PRICE_TRENDFOLLOW0_,  // TrendFollow_1 Price
   PRICE_TRENDFOLLOW1_   // TrendFollow_2 Price
  };
//+----------------------------------------------+
//|  Indicator input parameters                  |
//+----------------------------------------------+
input int g_period=30;                // Period
input Applied_price_ IPC=PRICE_CLOSE; // Applied price
//+----------------------------------------------+
//---- declaration of dynamic arrays that
//---- will be used as indicator buffers
double ExtBuffer[],ColorExtBuffer[];
//---- declaration of the integer variables for the start of data calculation
int min_rates_total;
//+------------------------------------------------------------------+
//| Custom indicator initialization function                         |
//+------------------------------------------------------------------+
int OnInit()
  {
//---- initialization of variables of the start of data calculation
   min_rates_total=g_period+1;

//---- set ExtBuffer[] dynamic array as an indicator buffer
   SetIndexBuffer(0,ExtBuffer,INDICATOR_DATA);
//---- shifting the start of drawing MAPeriod indicator
   PlotIndexSetInteger(0,PLOT_DRAW_BEGIN,min_rates_total);

//---- set ColorExtBuffer[] dynamic array as an indicator buffer
   SetIndexBuffer(1,ColorExtBuffer,INDICATOR_COLOR_INDEX);
//---- performing the shift of the beginning of the indicator drawing
   PlotIndexSetInteger(1,PLOT_DRAW_BEGIN,min_rates_total);

//---- name for the data window and the label for sub-windows
   string short_name="SinTrend";
   IndicatorSetString(INDICATOR_SHORTNAME,short_name);
//----
   return(0);
  }
//+------------------------------------------------------------------+
//| Custom indicator iteration function                              |
//+------------------------------------------------------------------+
int OnCalculate(const int rates_total,    // number of bars in history at the current tick
                const int prev_calculated,// number of bars calculated at previous call
                const datetime &time[],
                const double &open[],
                const double& high[],     // price array of maximums of price for the indicator calculation
                const double& low[],      // price array of minimums of price for the indicator calculation
                const double &close[],
                const long &tick_volume[],
                const long &volume[],
                const int &spread[])
  {
//---- checking the number of bars to be enough for the calculation
   if(rates_total<min_rates_total) return(0);

//---- declarations of local variables
   int first,bar;

//---- calculation of the 'first' starting index for the bars recalculation loop
   if(prev_calculated>rates_total || prev_calculated<=0) // checking for the first start of the indicator calculation
      first=min_rates_total+1; // starting index for calculation of all bars
   else first=prev_calculated-1; // starting index for calculation of new bars

//---- main indicator calculation loop
   for(bar=first; bar<rates_total && !IsStopped(); bar++)
     {
      ExtBuffer[bar]=MathSin((PriceSeries(IPC,bar,open,low,high,close)-PriceSeries(IPC,bar-g_period,open,low,high,close))/g_period);
      ColorExtBuffer[bar]=0;
      if(ExtBuffer[bar]>0) ColorExtBuffer[bar]=2;
      if(ExtBuffer[bar]<0) ColorExtBuffer[bar]=1;
     }
//----
   return(rates_total);
  }
//+------------------------------------------------------------------+
//| Getting values of a price time series                            |
//+------------------------------------------------------------------+
double PriceSeries(uint applied_price, // applied price
                   uint   bar,         // index of shift relative to the current bar for a specified number of periods back or forward
                   const double &Open[],
                   const double &Low[],
                   const double &High[],
                   const double &Close[])
  {
//----
   switch(applied_price)
     {
      //---- price constants from the ENUM_APPLIED_PRICE enumeration
      case  PRICE_CLOSE: return(Close[bar]);
      case  PRICE_OPEN: return(Open [bar]);
      case  PRICE_HIGH: return(High [bar]);
      case  PRICE_LOW: return(Low[bar]);
      case  PRICE_MEDIAN: return((High[bar]+Low[bar])/2.0);
      case  PRICE_TYPICAL: return((Close[bar]+High[bar]+Low[bar])/3.0);
      case  PRICE_WEIGHTED: return((2*Close[bar]+High[bar]+Low[bar])/4.0);
      //----
      case  8: return((Open[bar] + Close[bar])/2.0);
      case  9: return((Open[bar] + Close[bar] + High[bar] + Low[bar])/4.0);
      //----
      case 10:
        {
         if(Close[bar]>Open[bar])return(High[bar]);
         else
           {
            if(Close[bar]<Open[bar])
               return(Low[bar]);
            else return(Close[bar]);
           }
        }
      //----
      case 11:
        {
         if(Close[bar]>Open[bar])return((High[bar]+Close[bar])/2.0);
         else
           {
            if(Close[bar]<Open[bar])
               return((Low[bar]+Close[bar])/2.0);
            else return(Close[bar]);
           }
         break;
        }
      //----
      default: return(Close[bar]);
     }
//----
  }
//+------------------------------------------------------------------+

