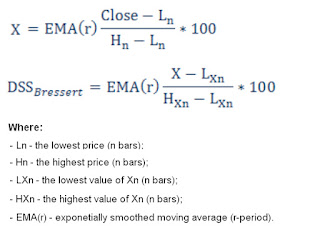
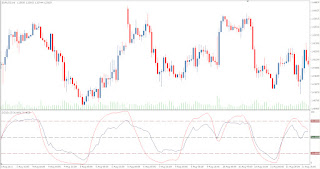
Double Smoothed Stochastics - DSS Bressert is an oscillator, which was presented by William Blau and Walter Bressert briefly in two slightly different versions in succession. The calculation of DSS Bressert values is similar to Stochastic indicator, the difference is the use of double exponentially smoothing. The advantages over the classical stochastics oscillators are the speed in response to price changes in a still very uniform flow pattern. Furthermore, the extreme zones on the other end of the scale are achieved even in strong trending quite often, resulting in many trend compliant signals. Double Smoothed Stochastics - DSS Bressert values is the same as for Stochastic - the values above 80 indicates the overbought state of the market, the values below 20 indicates the oversold market state.
Mathematical Formula:
//+------------------------------------------------------------------+
//|                                                 DSS Bressert.mq4 |
//|                      Copyright © 2008, MetaQuotes Software Corp. |
//|                                       http://www.metaquotes.net/ |
//+------------------------------------------------------------------+
#property copyright "Copyright © 2008, MetaQuotes Software Corp."
#property link      "http://www.metaquotes.net/"

#property indicator_separate_window
#property indicator_minimum 0
#property indicator_maximum 100
#property indicator_buffers 2
#property indicator_color1 Red
#property indicator_color2 DarkBlue
#property indicator_level1 20
#property indicator_level2 80

//---- input parameters
extern int       EMA_period=8;
extern int       Stochastic_period=13;
//---- buffers
double DssBuffer[];
double MitBuffer[];

double smooth_coefficient;
//+------------------------------------------------------------------+
//| Custom indicator initialization function                         |
//+------------------------------------------------------------------+
int init()
  {
//---- indicators
   SetIndexStyle(0,DRAW_LINE);
   SetIndexBuffer(0,DssBuffer);
   SetIndexStyle(1,DRAW_LINE);
   SetIndexBuffer(1,MitBuffer);

   SetIndexEmptyValue(0, 0.0);
   SetIndexLabel(0, "DSS");
   SetIndexEmptyValue(1, 0.0);
   SetIndexLabel(1, "MIT");

   IndicatorShortName ("DSS("+EMA_period+","+Stochastic_period+")");

   smooth_coefficient = 2.0 / (1.0 + EMA_period);
//----
   return(0);
  }
//+------------------------------------------------------------------+
//| Custom indicator deinitialization function                       |
//+------------------------------------------------------------------+
int deinit()
  {
//----

//----
   return(0);
  }
//+------------------------------------------------------------------+
//| Custom indicator iteration function                              |
//+------------------------------------------------------------------+
int start()
  {
   int i, limit, counted_bars=IndicatorCounted();
//----
   if (counted_bars == 0)   limit = Bars - Stochastic_period;
   if (counted_bars > 0)   limit = Bars - counted_bars;

   double HighRange, LowRange;
   double delta, MIT;
   for (i = limit; i >= 0; i--)
      {
      HighRange = High[iHighest(NULL,0,MODE_HIGH,Stochastic_period,i)];
      LowRange = Low[iLowest(NULL,0,MODE_LOW,Stochastic_period,i)];
      delta = Close[i] - LowRange;
      MIT = delta/(HighRange - LowRange)*100.0;
      MitBuffer[i] = smooth_coefficient * (MIT - MitBuffer[i+1]) + MitBuffer[i+1];
      }

   double DSS;
   for (i = limit; i >= 0; i--)
      {
      HighRange = MitBuffer[ArrayMaximum(MitBuffer, Stochastic_period, i)];
      LowRange = MitBuffer[ArrayMinimum(MitBuffer, Stochastic_period, i)];
      delta = MitBuffer[i] - LowRange;
      DSS = delta/(HighRange - LowRange)*100.0;
      DssBuffer[i] = smooth_coefficient * (DSS - DssBuffer[i+1]) + DssBuffer[i+1];
      }

//----
   return(0);
  }
//+------------------------------------------------------------------+
//+------------------------------------------------------------------+
//|                                                 DSS Bressert.mq5 |
//|                      Copyright © 2008, MetaQuotes Software Corp. |
//|                                       http://www.metaquotes.net/ |
//+------------------------------------------------------------------+
#property copyright "Copyright © 2008, MetaQuotes Software Corp."
#property link      "http://www.metaquotes.net/"
//---- indicator version
#property version   "1.00"
//---- plot indicator in a separate window
#property indicator_separate_window
//---- indicator buffers
#property indicator_buffers 2
//---- ndicator plots
#property indicator_plots   1
//+-----------------------------------+
//| Indicator plot settings           |
//+-----------------------------------+
//---- drawing type
#property indicator_type1   DRAW_FILLING
//---- colors
#property indicator_color1 Blue,DeepPink
//---- label
#property indicator_label1  "DSS Bressert"
//+----------------------------------------------+
//| Horizontal levels                            |
//+----------------------------------------------+
#property indicator_level1 80.0
#property indicator_level2 20.0
#property indicator_levelcolor Gray
#property indicator_levelstyle STYLE_DASHDOTDOT

//+-----------------------------------+
//| Indicator input parameters        |
//+-----------------------------------+
input uint  EMA_period=8;  // EMA period
input uint  Sto_period=13; // Stochastic period
input int   Shift=0;       // Horizontal shift (in bars)
//+-----------------------------------+
//---- declaration of integer variables
int min_rates_total;
//---- declaration of dynamic arrays, used as indicator buffers
double DssBuffer[],MitBuffer[];
//---- declaration of local variables
double smooth_coefficient;
//+------------------------------------------------------------------+
//| XMA indicator initialization function                            |
//+------------------------------------------------------------------+
void OnInit()
  {
//---- calc min rates needed
   min_rates_total=int(Sto_period+1);

//---- initialization of variables
   smooth_coefficient=2.0/(1.0+EMA_period);

//---- set DssBuffer[] as indicator buffer
   SetIndexBuffer(0,DssBuffer,INDICATOR_DATA);
//---- set plot shift
   PlotIndexSetInteger(0,PLOT_SHIFT,Shift);
//---- set plot draw begin
   PlotIndexSetInteger(0,PLOT_DRAW_BEGIN,min_rates_total);
//---- define empty value (not plotted at chart)
   PlotIndexSetDouble(0,PLOT_EMPTY_VALUE,EMPTY_VALUE);
//---- set indexing as time series
   ArraySetAsSeries(DssBuffer,true);

//---- set MitBuffer[] as indicator buffer
   SetIndexBuffer(1,MitBuffer,INDICATOR_DATA);
//---- set plot shift
   PlotIndexSetInteger(1,PLOT_SHIFT,Shift);
//---- set plot draw begin
   PlotIndexSetInteger(1,PLOT_DRAW_BEGIN,min_rates_total);
//---- define empty value (not plotted at chart)
   PlotIndexSetDouble(1,PLOT_EMPTY_VALUE,EMPTY_VALUE);
//---- set indexing as time series
   ArraySetAsSeries(MitBuffer,true);

//---- prepare indicator short name
   string shortname;
   StringConcatenate(shortname,"DSS Bressert(",EMA_period,", ",Sto_period,")");
//--- set indicator short name (shown in the separate window and tooltip)
   IndicatorSetString(INDICATOR_SHORTNAME,shortname);

//--- set precision
   IndicatorSetInteger(INDICATOR_DIGITS,0);
//---- initialization finished
  }
//+------------------------------------------------------------------+
//| XMA iteration function                                           |
//+------------------------------------------------------------------+
int OnCalculate(const int rates_total,    // number of bars in history at current tick
                const int prev_calculated,// number of bars, calculated at previous call
                const datetime &time[],
                const double &open[],
                const double &high[],
                const double &low[],
                const double &close[],
                const long &tick_volume[],
                const long &volume[],
                const int &spread[])
  {
//---- checking of bars
   if(rates_total<min_rates_total) return(0);

//---- declare variables of double type
   double HighRange,LowRange,delta,MIT,DSS;
//---- declare variables of integer type (used for calculated bars)
   int limit,bar;

//---- set indexing as time series
   ArraySetAsSeries(low,true);
   ArraySetAsSeries(high,true);
   ArraySetAsSeries(close,true);

//---- calculation of limit starting bar index
   if(prev_calculated>rates_total || prev_calculated<=0)// checking of first call
     {
      limit=rates_total-min_rates_total-1; // starting bar index for all bars
      MitBuffer[limit+1]=50;
      DssBuffer[limit+1]=50;
     }
   else limit=rates_total-prev_calculated; // starting bar index for new bars

//---- calculation of Mit indicator values
   for(bar=limit; bar>=0 && !IsStopped(); bar--)
     {
      HighRange=high[ArrayMaximum(high,bar,Sto_period)];
      LowRange=low[ArrayMinimum(low,bar,Sto_period)];
      delta=close[bar]-LowRange;
      MIT=delta/(HighRange-LowRange)*100.0;
      MitBuffer[bar]=smooth_coefficient*(MIT-MitBuffer[bar+1])+MitBuffer[bar+1];
     }

//---- calculation of DSS indicator values
   for(bar=limit; bar>=0 && !IsStopped(); bar--)
     {
      HighRange=MitBuffer[ArrayMaximum(MitBuffer,bar,Sto_period)];
      LowRange=MitBuffer[ArrayMinimum(MitBuffer,bar,Sto_period)];
      delta=MitBuffer[bar]-LowRange;
      DSS=delta/(HighRange-LowRange)*100.0;
      DssBuffer[bar]=smooth_coefficient*(DSS-DssBuffer[bar+1])+DssBuffer[bar+1];
     }
//----
   return(rates_total);
  }
//+------------------------------------------------------------------+


