

| Volume |
| Volume |
| Volume |
| Volume |
Volume is the second most valuable data after the price itself. Large volume signifies that there is large number of market participants involved, including financial institutions. Volume indicators are used to determine investors' interest in the market. High volume, especially near important market levels, suggests a possible start of a new trend, while low volume suggests traders uncertainty and/or no interest in a particular market. Small volume tells that there are very little participants in the market, neither buyers no sellers have any significant interest in the price.
Interesting article about Trading volume strategy:
Combining Price and Volume to Predict Price Movement
I use a lot of different indicators and methods, but the one that has shown me consistent success is price and volume at support and resistance. Support or resistance areas come at previous highs and lows (that is why stock and indexes develop trading ranges, they bounce off previous highs and lows). I will show you how price and volume react to previous highs and lows and why price pushes through or reverses at these points. Previous highs and lows in a stock or Index define current support and resistance areas. A Previous high or low in a stock or index is called a swing. I draw a horizontal trend line from the previous swing high or low to see at what price support or resistance will come in at in the future. These previous swing highs and lows are places where decisions are to be made for buy or sell orders. The horizontal lines drawn from previous highs and lows indicate where the support or resistance may come in the future. Sometimes a picture is worth 1000 words. The Line graph of a stock or index below illustrates what a swing high and low are.

The following rules I have developed with price and volume came in part with studying the works of the master of price and volume, Richard Wyckoff. Mr. Wyckoff developed techniques in the 1930's that combine price and volume of equities that had price predictability. The techniques he developed stood the test of time and still work to this day. I have expanded on these ideas and came up with the following rules that I use daily in my trading. In order to keep this article brief, I will not go into all of the rules, but here are some that we can go over. Here we will view a price history to see where buy and sell signals developed.
Rules that I follow using price and volume to determine buy and sell signals on the Nasdaq composite and the NYSE indexes
1. Test of a previous high or low on 8% or greater decrease in volume and closes back below the previous high (or above previous low) imply a reversal. The market needs to break the previous high or low and then close back into the trading range to prove the point.

2. Test of a previous high or low on 3% or less in volume shrinkage, imply that high or low will be exceeded.

3. Always compare volume relationship to first high or low; even on 3rd and 4th re-test. The volume buy and sell signal relationship stay the same.

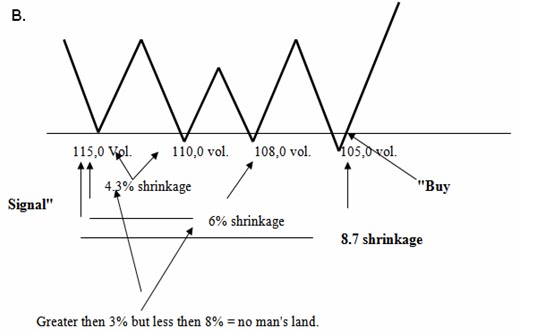
Important Note: It's not what the volume figures themselves are that is important on re-test of previous highs or lows, but rather what percentage increase or decrease the volume has against previous highs or lows. These volume relationships will define if the market will pass through or reverse at these previous highs and lows.
4. Markets that break to new highs (or lows) on near equal or increased volume and then reverse back into the trading range, the last high (or low) will be tested if not exceeded.

PS. The way to tell if the last high (or low) will be tested then reversed or exceeded is in the volume.
- If volume is at least 8% lighter on test of high (or low) then expect reversal.
- If volume is within 3% or less on test then expect continuation.
5. Markets that break to new high or low on 8% or greater decrease in volume and close outside of the trading range imply a false break and will come back into the trading range.

6. Tops and bottoms of "gaps" act and work the same way as previous highs and lows. Tops and bottoms of gaps act and work like previous support and resistance zones. The same volume percent relationship works with the "Gaps" as they do with re-test of previous highs and lows.

See document...
Volume Indicator MQ4 Code Base (Copy Code)
//+------------------------------------------------------------------+
//|                                                      Volumes.mq4 |
//|                      Copyright © 2005, MetaQuotes Software Corp. |
//|                                       http://www.metaquotes.net/ |
//+------------------------------------------------------------------+
#property copyright "Copyright © 2005, MetaQuotes Software Corp."
#property link      "http://www.metaquotes.net/"
//---- indicator settings
#property  indicator_separate_window
#property indicator_minimum 0
#property indicator_buffers 3
#property indicator_color1  Black
#property indicator_color2  Green
#property indicator_color3  Red
#property indicator_width2  2
#property indicator_width3  2
//---- indicator buffers
double ExtVolumesBuffer[];
double ExtVolumesUpBuffer[];
double ExtVolumesDownBuffer[];

//+------------------------------------------------------------------+
//| Custom indicator initialization function                         |
//+------------------------------------------------------------------+
int init()
  {
//---- indicator buffers mapping
   SetIndexBuffer(0,ExtVolumesBuffer);
   SetIndexBuffer(1,ExtVolumesUpBuffer);
   SetIndexBuffer(2,ExtVolumesDownBuffer);
//---- drawing settings
   SetIndexStyle(0,DRAW_NONE);
   SetIndexStyle(1,DRAW_HISTOGRAM);
   SetIndexStyle(2,DRAW_HISTOGRAM);
//---- sets default precision format for indicators visualization
   IndicatorDigits(0);
//---- name for DataWindow and indicator subwindow label
   IndicatorShortName("Volumes");
   SetIndexLabel(0,"Volumes");
   SetIndexLabel(1,NULL);
   SetIndexLabel(2,NULL);
//---- sets drawing line empty value
   SetIndexEmptyValue(1,0.0);
   SetIndexEmptyValue(2,0.0);
//---- initialization done
   return(0);
  }
//+------------------------------------------------------------------+
//| Volumes                                                          |
//+------------------------------------------------------------------+
int start()
  {
   int    i,nLimit,nCountedBars;
//---- bars count that does not changed after last indicator launch.
   nCountedBars=IndicatorCounted();
//---- last counted bar will be recounted
   if(nCountedBars>0) nCountedBars--;
   nLimit=Bars-nCountedBars;
//----
   for(i=0; i<nLimit; i++)
     {
      double dVolume=Volume[i];
      if(i==Bars-1 || dVolume>Volume[i+1])
        {
         ExtVolumesBuffer[i]=dVolume;
         ExtVolumesUpBuffer[i]=dVolume;
         ExtVolumesDownBuffer[i]=0.0;
        }
      else
        {
         ExtVolumesBuffer[i]=dVolume;
         ExtVolumesUpBuffer[i]=0.0;
         ExtVolumesDownBuffer[i]=dVolume;
        }
     }
//---- done
   return(0);
  }
//+------------------------------------------------------------------+
Volume Indicator MQ5 Code Base (Copy Code)
//+------------------------------------------------------------------+
//|                                                      Volumes.mq5 |
//|                        Copyright 2009, MetaQuotes Software Corp. |
//|                                              http://www.mql5.com |
//+------------------------------------------------------------------+
#property copyright "2009, MetaQuotes Software Corp."
#property link      "http://www.mql5.com"
//---- indicator settings
#property indicator_separate_window
#property indicator_buffers 2
#property indicator_plots   1
#property indicator_type1   DRAW_COLOR_HISTOGRAM
#property indicator_color1  Green,Red
#property indicator_style1  0
#property indicator_width1  1
#property indicator_minimum 0.0
//--- input data
input ENUM_APPLIED_VOLUME InpVolumeType=VOLUME_TICK; // Volumes
//---- indicator buffers
double                    ExtVolumesBuffer[];
double                    ExtColorsBuffer[];
//+------------------------------------------------------------------+
//| Custom indicator initialization function                         |
//+------------------------------------------------------------------+
void OnInit()
  {
//---- buffers
   SetIndexBuffer(0,ExtVolumesBuffer,INDICATOR_DATA);
   SetIndexBuffer(1,ExtColorsBuffer,INDICATOR_COLOR_INDEX);
//---- name for DataWindow and indicator subwindow label
   IndicatorSetString(INDICATOR_SHORTNAME,"Volumes");
//---- indicator digits
   IndicatorSetInteger(INDICATOR_DIGITS,0);
//----
  }
//+------------------------------------------------------------------+
//|  Volumes                                                         |
//+------------------------------------------------------------------+
int OnCalculate(const int rates_total,const int prev_calculated,
                const datetime &Time[],
                const double &Open[],
                const double &High[],
                const double &Low[],
                const double &Close[],
                const long &TickVolume[],
                const long &Volume[],
                const int &Spread[])
  {
//---check for rates total
   if(rates_total<2)
      return(0);
//--- starting work
   int start=prev_calculated-1;
//--- correct position
   if(start<1) start=1;
//--- main cycle
   if(InpVolumeType==VOLUME_TICK)
      CalculateVolume(start,rates_total,TickVolume);
   else
      CalculateVolume(start,rates_total,Volume);
//--- OnCalculate done. Return new prev_calculated.
   return(rates_total);
  }
//+------------------------------------------------------------------+
//|                                                                  |
//+------------------------------------------------------------------+
void CalculateVolume(const int nPosition,
                     const int nRatesCount,
                     const long &SrcBuffer[])
  {
   ExtVolumesBuffer[0]=SrcBuffer[0];
   ExtColorsBuffer[0]=0.0;
//---
   for(int i=nPosition;i<nRatesCount;i++)
     {
      //--- get some data from src buffer
      double dCurrVolume=SrcBuffer[i];
      double dPrevVolume=SrcBuffer[i-1];
      //--- calculate indicator
      ExtVolumesBuffer[i]=dCurrVolume;
      if(dCurrVolume>dPrevVolume)
         ExtColorsBuffer[i]=0.0;
      else
         ExtColorsBuffer[i]=1.0;
     }
//---
  }
//+------------------------------------------------------------------+