 |
| Kaufman |
 |
| Kaufman |
 |
| Kaufman |
 |
| Kaufman |
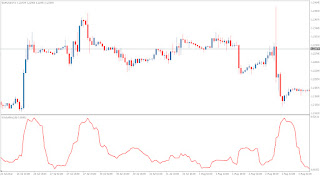
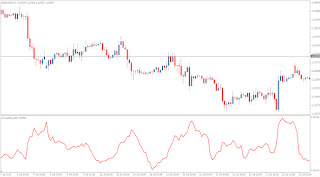
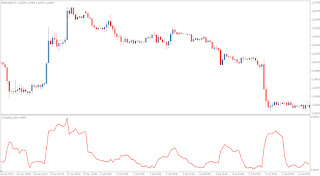
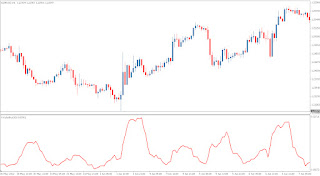
Kaufman Volatility Indicator developed by Perry Kaufman. Perry Kaufman this indicator described in more detail in his book Trading Systems & Methods and Smarter Trading. Kaufman Volatility Is the indicator that measures market volatility, its span. It is appropriate to combine this with a trend indicator or volume indicators, such as
Moving Average,
Bollinger Bands,
METRO,
Ichimoku Kinko Hyo, etc.
Kaufman Volatility Indicator MQ4 Code Base (Copy Code)
//+--------------------------------------------------------------------------------------------------+
//|                                                                         b_Kaufman_Volatility.mq4 |
//|                                                                    Copyright © 2011, barmenteros |
//|                                                            http://www.mql4.com/users/barmenteros |
//+--------------------------------------------------------------------------------------------------+
#property copyright "barmenteros"
#property link      "barmenteros.fx@gmail.com"

#property indicator_separate_window
#property indicator_buffers 1
#property indicator_color1 Red

// ---- inputs
// ERperiod    It should be >0. If not it will be autoset to default value
// histogram   [true] - histogram style on; [false] - histogram style off
extern int       ERperiod     =10;              // Efficiency ratio period
extern bool      histogram    =false;           // Histogram switch
extern int       shift        =0;               // Sets offset

// ---- buffers
double KVBfr[];

// ---- global variables
double   noise;

//+--------------------------------------------------------------------------------------------------+
//| Custom indicator initialization function                                                         |
//+--------------------------------------------------------------------------------------------------+
int init()
  {
   string short_name;

   // ---- checking inputs
   if(ERperiod<=0)
      {
       ERperiod=10;
       Alert("ERperiod readjusted");
      }

   // ---- drawing settings
   if(!histogram) SetIndexStyle(0,DRAW_LINE);
   else           SetIndexStyle(0,DRAW_HISTOGRAM);
   SetIndexLabel(0,"KVolatility");
   SetIndexShift(0,shift);
   IndicatorDigits(MarketInfo(Symbol(),MODE_DIGITS));
   short_name="KVolatility(";
   IndicatorShortName(short_name+ERperiod+")");

   // ---- mapping
   SetIndexBuffer(0,KVBfr);

   // ---- done
   return(0);
  }

//+--------------------------------------------------------------------------------------------------+
//| Custom indicator iteration function                                                              |
//+--------------------------------------------------------------------------------------------------+
int start()
  {
   // ---- optimization
   if(Bars<ERperiod+2) return(0);

   int counted_bars=IndicatorCounted(),
       limit, maxbar,
       i;

   if(counted_bars<0) return(-1);
   if(counted_bars>0) counted_bars--;

   limit=Bars-counted_bars-1;
   maxbar=Bars-1-ERperiod;
   if(limit>maxbar) limit=maxbar;

   // ---- main cycle
   for(i=limit; i>=0; i--)
      {
       noise=Volatility(i);
       if(noise==EMPTY_VALUE) continue;
       KVBfr[i]=noise;
      }

   // ----
   return(0);
  }

double Volatility(int initialbar)
   {
    if(initialbar>Bars-ERperiod-1) return(EMPTY_VALUE);
    int j;
    double v=0.0;
    for(j=0; j<ERperiod; j++)
      v+=MathAbs(Close[initialbar+j]-Close[initialbar+1+j]);
    return(v);
   }

